
2026 College Football Preview by the Numbers: Part 1 — What 2025 Taught Us
Dr. Green and White uses math, statistics, and preseason projections to look back at 2025 and identify what it may tell us about the 2026 college football season.
It is a new dawn and a new day for Michigan State football. First-year head coach Pat Fitzgerald attended Big Ten Football Media Days this week wearing green and white for the first time. In a little over a month, the latest iteration of Spartan football will take to the field. Only time will tell whether the new regime can elevate the Spartans back toward their previous heights.
In the meantime, it is time to kick off my annual preview of the upcoming college football season. Over the past several years, I have developed and refined a set of mathematical tools to better understand the sport. With the 2026 season approaching, it is time to open the analytical toolbox and see what we can learn.
Before we dive into the upcoming season for the Michigan State Spartans and beyond, it will be helpful to review the results of the past season.
General Lessons from the Past
During the summer, college football fans and analysts have limited information. Still, there is no shortage of predictions about rankings, win totals, conference champions, and playoff participants. But how accurate are those predictions, historically?
After collecting and studying these data for several years, the simple answer is that experts are reasonably accurate on average, but the variance is significant. More quantitatively, I have developed two rules of thumb:
Preseason rankings are accurate to plus or minus 25 positions, or one standard deviation.
Preseason win-total predictions are accurate to roughly 2.0 to 2.5 games, depending on the year.
This context is helpful when evaluating preseason rankings and win predictions in July or August. Both data sets resemble a bell curve, or normal distribution. The math tells us that roughly one-third of teams will finish more than 25 spots above or below their preseason ranking, and more than two games above or below their projected win total.
Additional analysis also helps identify the factors behind those misses. I have found that the gap between a team's final win total and its preseason expectation is driven by three factors: changes in schedule strength, luck or “grit,” and the accuracy of preseason evaluations of team strength.
These three factors do not contribute equally to the final difference between prediction and eventual reality. Here is another rule of thumb:
Changes in schedule difficulty contribute plus-or-minus half of a win (one standard deviation)
Luck/grit (good or bad) contributes about plus-or-minus one win.
Differences in the perceived strength of a team in the preseason contributes plus-or-minus two wins.
Some teams are luckier than others, and some wind up playing easier or harder schedules than expected. But the largest factor is simpler: preseason experts often do not have a firm grasp on how good or bad each team will be.
2025 Preseason Polls in Retrospect
With that context, Table 1 shows last year’s preseason top 25 and beyond, based on a consensus of preseason publications. It also includes the final AP ranking, my final power ranking, final record, and preseason expected win total from my calculations last summer.
The table also shows my calculations for how changes in ability, schedule, and luck affected each team's final regular-season win total. These cells are color-coded to indicate whether the impact was positive or negative.
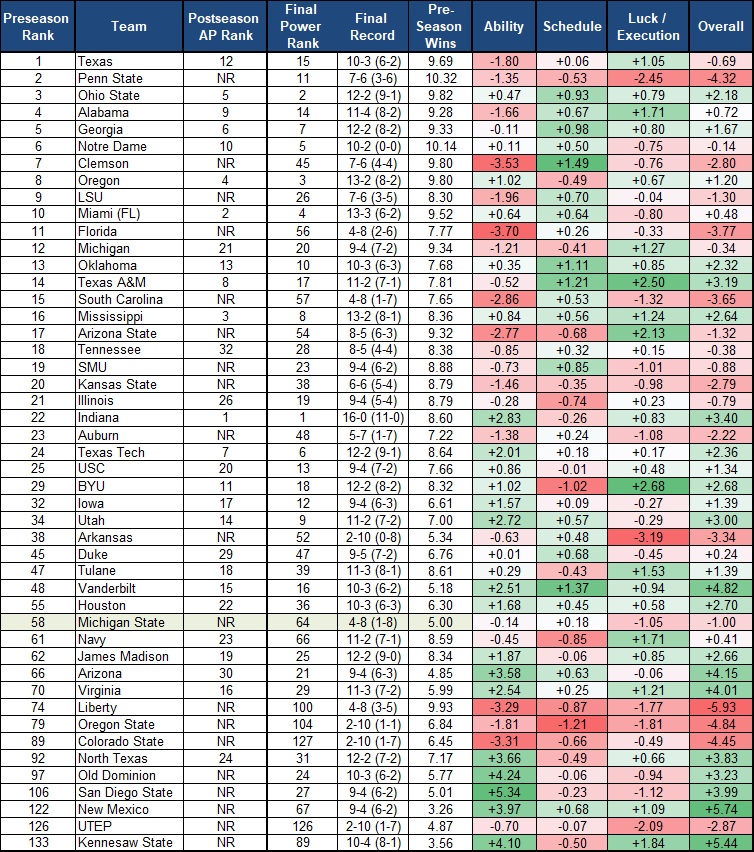 Table 1: 2025 preseason consensus rankings compared to the year-end results.
The table is sorted based on the preseason rankings, similar to the information available to college football fans this summer.
As an example, Michigan State started the 2025 season with a consensus ranking of No. 58. My detailed mathematical analysis of the full college football season and the Spartans' schedule resulted in a regular season expected win total of 5.00.
Michigan State finished 4-8, slightly below expectations. The Spartans ranked No. 64 in my final power rankings, suggesting that the prognosticators had assessed their true strength fairly accurately.
The right side of Table 1 provides more context. According to my calculations, the Spartans' postseason ability and schedule strength were very close to preseason expectations. Michigan State was slightly less talented than expected (-0.14 in ability), while the schedule was slightly easier by almost exactly the same amount (+0.18).
On balance, however, the Spartans absorbed just over a full game's worth of bad luck or poor grit (-1.05). Late collapses against Minnesota and at Iowa are prime examples of how that bad luck, or lack of ability to close out close games, showed up in 2025.
That bad luck, or lack of grit, is the primary reason Michigan State finished one win below expectations in 2025.
Overachievers and underachievers
The data in Table 1 can be used to understand the full results from the 2025 season in more detail.
Four of the top 10 preseason teams also ended the season outside of the top 10, which is consistent with historical average value of 4.6 over the past decade.
Preseason No. 1 Texas (10-3) finished No. 14 in the final AP poll. Worse yet, No. 2 Penn State, No. 7 Clemson, and No. 9 LSU all finished 7-6 and unranked. Of that group, Clemson was the only school whose head coach made it to the end of October.
Six other members of the 2025 preseason top 25 also finished unranked. No. 19 SMU (9-4) and No. 23 Arizona State (8-5) were somewhat underwhelming, while No. 20 Kansas State (6-6) ended up at .500. The biggest underachievers were No. 11 Florida (4-8), No. 15 South Carolina (4-8), and No. 24 Auburn (5-7), all of which missed bowl season despite fans' preseason dreams of playoff glory.
In contrast, a few teams outside the preseason top 10 had excellent seasons. No. 16 Ole Miss (13-2) and No. 24 Texas Tech both finished in the top seven of the final AP poll. Most notable was preseason No. 22 Indiana (16-0), which went undefeated and won the national championship.
Beyond the preseason top 25, several teams surprised. Vanderbilt, ranked No. 48 in the preseason consensus, finished 10-3 and No. 16 in the final AP poll. No. 34 Utah (11-2, No. 14 in the final AP poll) and No. 47 Tulane (11-3, No. 18) also overachieved significantly.
Similarly, No. 55 Houston (10-3, No. 22), No. 62 James Madison (12-2, No. 19), No. 66 Arizona (9-4, No. 30), and No. 70 Virginia (11-3, No. 16) all started the 2025 season ranked similarly to the Spartans but ended up with much more successful seasons.
Other notable overachievers from farther down the preseason rankings included No. 92 North Texas (12-2, No. 24), No. 97 Old Dominion (10-2, and No. 24 in my final power ranking), No. 106 San Diego State (9-4, No. 27), No. 122 New Mexico (9-4, No. 67), and Conference USA champion Kennesaw State (10-4, No. 98), which started the season ranked No. 133 of 136 Division I teams.
Digging Deeper into the Data
Looking at records and raw rankings before and after the season identifies which teams overachieved or underachieved. The data on the right side of Table 1 helps explain why.
Generally, the expected number of wins for even the top five teams in the preseason are usually just above 10 wins out of 12 games. A team needs a bit of positive luck to finish the regular season with 11 or 12 wins.
In any given year, the teams that finish in the top 10 are typically both lucky and good. In 2025, Table 1 generally bears that out. National champion Indiana was more talented than expected by +2.83 games and had a +0.83 bump in luck. National semifinalists Ole Miss and Oregon were +0.84 and +1.02 in ability and +1.24 and +0.67 in luck, respectively.
However, there are a few exceptions. Alabama (11-4) and Texas A&M (11-2) both finished in the top 10 in the final AP poll. However, my final power rankings and analysis suggests that both teams were slightly less talented than the final records and rankings suggest.
My calculations show that Texas A&M was about a half game less talented than the preseason ranking of No. 14 implied. Alabama had an ability score of -1.66 wins relative to a preseason ranking of No. 4.
However, that apparent talent deficit was more than offset by above-average luck. Alabama posted a luck score of +1.71 wins, No. 11 nationally. Texas A&M posted a luck score of +2.50, second nationally behind only BYU (+2.68).
The Aggies also benefited from a schedule that was much easier than expected (+1.21) which was the third highest of all teams in 2025 behind only Clemson (+1.49) and Vanderbilt (+1.37).
A majority of the overachievers in 2025 were simply better and more talented than expected. Indiana (+2.83), Texas Tech (+2.01), Utah (+2.72), Vanderbilt (+2.51), Virginia (+2.54), Iowa (+1.57), James Madison (+1.87), Houston (+1.68), and Arizona (+3.58) all had final ability scores of at least +1.5 wins relative to preseason expectations.
Conversely, teams such as Texas (-1.80), Alabama (-1.66), Michigan (-1.21), Penn State (-1.35), LSU (-1.96), Kansas State (-1.46), Clemson (-3.53), Auburn (-1.38), Arizona State (-2.77), Florida (-3.70), and South Carolina (-2.85) were simply not as good as predicted last summer.
Table 1 also reveals which teams were the most impacted by positive or negative luck. As mentioned above, good luck helped to disguise a slip in talent for both Texas A&M and Alabama. Michigan and Arizona State fell into the same category.
Good fortune also bolstered the seasons of BYU (+2.68), Tulane (+1.53), and Navy (+1.71).
On the other side of the coin, there are a few teams where bad luck made an unexpected drop in talent even worse. Penn State was not as good as expected, but the Nittany Lions had -2.45 games of bad luck as well. South Carolina (-1.32), SMU (-1.01), Auburn (-1.08), and especially Arkansas (-3.19) all had deficiencies in talent exacerbated by poor luck.
The impact of schedule difficulty is generally smaller, but it still mattered for a handful of teams in 2025. Easier-than-expected schedules helped Ohio State (+0.93), Georgia (+0.98), Oklahoma (+1.11), Texas A&M (+1.21), and Vanderbilt (+1.37). It also helped soften Clemson's disappointing season (+1.49).
The notable teams most disadvantaged by schedule difficulty were BYU (-1.02), Navy (-0.85), and Illinois (-0.74).
Looking Ahead to 2026
With this information in mind, it may be possible to make some initial predictions as to which teams might be overrated or underrated in 2026. Teams which benefited or suffered due to a significant amount of luck in 2025 may be more likely to regress to the mean in 2026.
Last year at this time, my analysis correctly suggested that Clemson, LSU, and Florida were all overrated. It was also optimistic about the chances for Ole Miss, Utah, USC, and Iowa.
That said, my analysis was also skeptical about the prospects for Georgia, Oregon, Miami, and Texas Tech but more optimistic about Auburn, Virginia Tech, Louisville, Kansas and Oklahoma State.
Looking through the preseason top 25 for 2026, several teams stand out as having benefited significantly last year from schedule variance and luck. Top-10 teams such as Ohio State, Texas, Georgia, Texas A&M, and Oklahoma may have inflated preseason rankings.
Farther down the standings, my analysis suggests skepticism regarding Alabama, Ole Miss, and BYU.
Conversely, my analysis suggests that teams such as Oregon, Notre Dame, Penn State and Miami, all of which had more neutral or bad luck in 2025, could be a little better than expected this coming season.
This reasoning also suggests a list of potential dark horses in notable conference races. In the ACC, Florida State and Virginia Tech could be teams to watch. In the Big 12, Kansas, Kansas State, and Oklahoma State could be better than expected. In the SEC, Arkansas could be a mild surprise.
Elsewhere in the FBS, keep an eye out for Oregon State, Washington State, Liberty, Georgia State, Toledo, UTEP, Northern Illinois, and Texas San Antonio as teams that could overachieve.
With this introduction in place, it is time to turn our focus to the Big Ten and, specifically, Michigan State. Next time, we will take a close look at the Spartans' schedule. Stay tuned.
Check out the other articles in this series:
